SCENIC
Preface
IMPORTANT
SCENIC (Single-Cell rEgulatory Network Inference and Clustering) is an important tool for inferring gene regulatory networks and cell states in single-cell transcriptomics. It helps researchers understand the transcriptional regulatory mechanisms underlying cellular heterogeneity and identify cell type-specific regulatory factors.
In single-cell studies, we not only focus on cell classification and marker genes, but also hope to gain deeper insights into the transcriptional regulatory networks that drive cell state transitions. SCENIC constructs cell-specific regulatory networks by integrating co-expression relationships between transcription factors and target genes as well as DNA motif analysis, providing important clues for understanding cell function and development.
Core Functions of SCENIC
- Gene Regulatory Network Inference: Infers regulatory relationships between transcription factors and target genes based on gene co-expression patterns
- Regulatory Activity Assessment: Calculates the activity state of regulators (Regulons) in each cell through the AUCell algorithm
- Cell State Identification: Groups and annotates cells based on regulatory network activity
- Regulon Specificity Analysis: Identifies regulatory factors specifically active in specific cell types
This document aims to provide single-cell researchers with a comprehensive SCENIC technical guide, covering its basic principles, operation methods on SeekSoulOnline, result interpretation, practical cases, and common questions, helping you quickly master and apply this tool.
SCENIC Theoretical Foundation
Core Principles
The core idea of SCENIC is: identifying co-expression modules of transcription factors and their target genes, and validating regulatory relationships through DNA motif analysis to construct cell-specific gene regulatory networks. This process can be summarized into three main steps:
- Gene Regulatory Network Inference (GRN inference): Uses GENIE3 or GRNBoost algorithms to infer regulatory relationships between transcription factors (TF) and potential target genes based on gene expression correlation
- Regulon Pruning and Enrichment Analysis: Uses RcisTarget to perform motif enrichment analysis on inferred regulatory relationships, removing false positive regulatory relationships to form reliable regulons (Regulon)
- Regulon Activity Assessment: Uses the AUCell algorithm to calculate the activity state (AUC value) of each regulon in each cell
Key Algorithm Details
1. GENIE3/GRNBoost - Gene Regulatory Network Inference
- Principle: Based on random forest or gradient boosting algorithms, calculates the correlation between each transcription factor and its potential target gene expression patterns
- Output: TF-target regulatory relationships and importance scores, with higher scores indicating more reliable regulatory relationships
2. RcisTarget - Motif Enrichment Analysis
- Principle: Based on known transcription factor binding site databases, performs motif enrichment analysis on inferred regulatory relationships
- Function: Validates the reliability of regulatory relationships, removes indirect regulation and false positive results
- Output: Pruned regulons (Regulon), containing TFs, target genes, and their motif information
3. AUCell - Regulon Activity Assessment
- Principle: Based on Gene Set Enrichment Analysis (GSEA) concept, calculates the enrichment degree of regulon target gene sets in each cell
- Output: Activity scores (AUC values) of each regulon in each cell, used for subsequent analysis
Regulon Specificity Analysis Metrics
1. RSS (Regulon Specificity Score)
- Definition: Specificity score of regulons in specific cell types
- Calculation: Based on distribution differences of AUC values across different cell types
- Application: Identifies cell type-specific key regulatory factors
2. Z-score
- Definition: Standardized activity score of regulons in specific cell types
- Calculation: Based on differences in AUC values of regulons between target cell types and other cell types
- Application: Quantifies relative activity of regulons in different cell types
SeekSoulOnline Operation Guide
On SeekSoulOnline, the SCENIC analysis workflow is designed to be intuitive and easy to use. You don't need to write code, just complete the analysis through the parameter configuration interface. 
Preparation Before Analysis
IMPORTANT
The success of SCENIC analysis largely depends on the quality of input data and the reasonableness of biological questions. Before starting the analysis, please ensure:
- Data has been preprocessed: Your single-cell data has undergone standard quality control, dimensionality reduction, clustering, and cell type annotation.
- Appropriate cell subpopulations are selected: SCENIC analysis should be performed in biologically meaningful cell subpopulations, such as annotated cell types or functionally related cell clusters.
- Ensure moderate data scale: For datasets exceeding tens of thousands of cells, it is recommended to enable Downsample for analysis to avoid insufficient memory.
Parameter Details
The following table details the main parameters and their descriptions of the SeekSoulOnline SCENIC analysis module.
| Interface Parameter | Description |
|---|---|
| Task Name | Name of this analysis task, must start with English letters. |
| Species | Select the species name corresponding to the data in this analysis workflow. Currently supports human, mouse, and fruit fly. |
| Group.by | Select the label corresponding to the cell type or cluster to analyze, such as celltype. |
| Cell Type | Multiple selection, select specific cell types or clusters to include in the analysis. |
| Split.by | Multiple selection, label used for splitting different groups when plotting, such as Group or Sample. |
| Downsample | Whether to randomly downsample large datasets. |
| Downsample_num | Number of cells retained after downsampling for each cell subpopulation. |
| Analysis Based on Historical Results | Select "Regulon Plotting" to re-plot based on completed analysis tasks. |
| Historical Task Name | Select a successful SCENIC task. |
| Regulon | In historical task results, select the Regulon name to re-plot. |
| Notes | Custom note information. |
Important Notes
CAUTION
- Large Dataset Processing: When the total number of cells exceeds tens of thousands, if the
Downsampleparameter is set toFalse, the analysis may fail due to insufficient memory. It is strongly recommended to enableDownsamplefor analysis. - Metadata Standards: Please ensure that metadata column names and content in RDS files do not contain Chinese characters or special characters (such as
&), otherwise it may cause workflow errors. - Species Matching: Ensure that the selected species matches the actual data, otherwise it will affect the accuracy of motif databases.
Operation Workflow
- Enter Analysis Module: Navigate to the "Advanced Analysis" module on SeekSoulOnline and select "scenic".
- Create New Task: Name your analysis task and select the samples or projects to analyze.
- Configure Parameters: According to the above guide, select cell types, grouping information, etc. to analyze.
- Submit Task: After confirming that parameters are correct, click the "Submit" button and wait for the analysis to complete.
- Download and View: After the analysis is complete, download and view the generated analysis reports and result files in the task list.
Result Interpretation
SCENIC's analysis report contains rich charts and data files. The following is a detailed interpretation of the core results.
1. Result File List
| File Name | Content Description |
|---|---|
adj_grn_filter.csv | Table after filtering co-expression modules based on motif analysis, can view TFs and their target gene correlations. |
reg_cxt.csv | TFs-motif analysis results, can search for motif logo images based on motifID. |
auc_mtx.csv | AUC scoring matrix file of Regulons in each cell. |
auc_thresholds.csv | Thresholds for determining whether Regulons are active in cells. |
binary_mtx.csv | Binary file converted from auc_mtx.csv based on auc_thresholds. |
celltype_rss.csv | Regulon specificity score results for each cell group analyzed. |
celltype_rss_top5reg.csv | Top 5 Regulons with specificity scores filtered from analyzed cell groups. |
celltype_z.csv | Z-value results of each Regulon for analyzed cell groups. |
2. Regulon Activity Visualization
AUC Heatmap
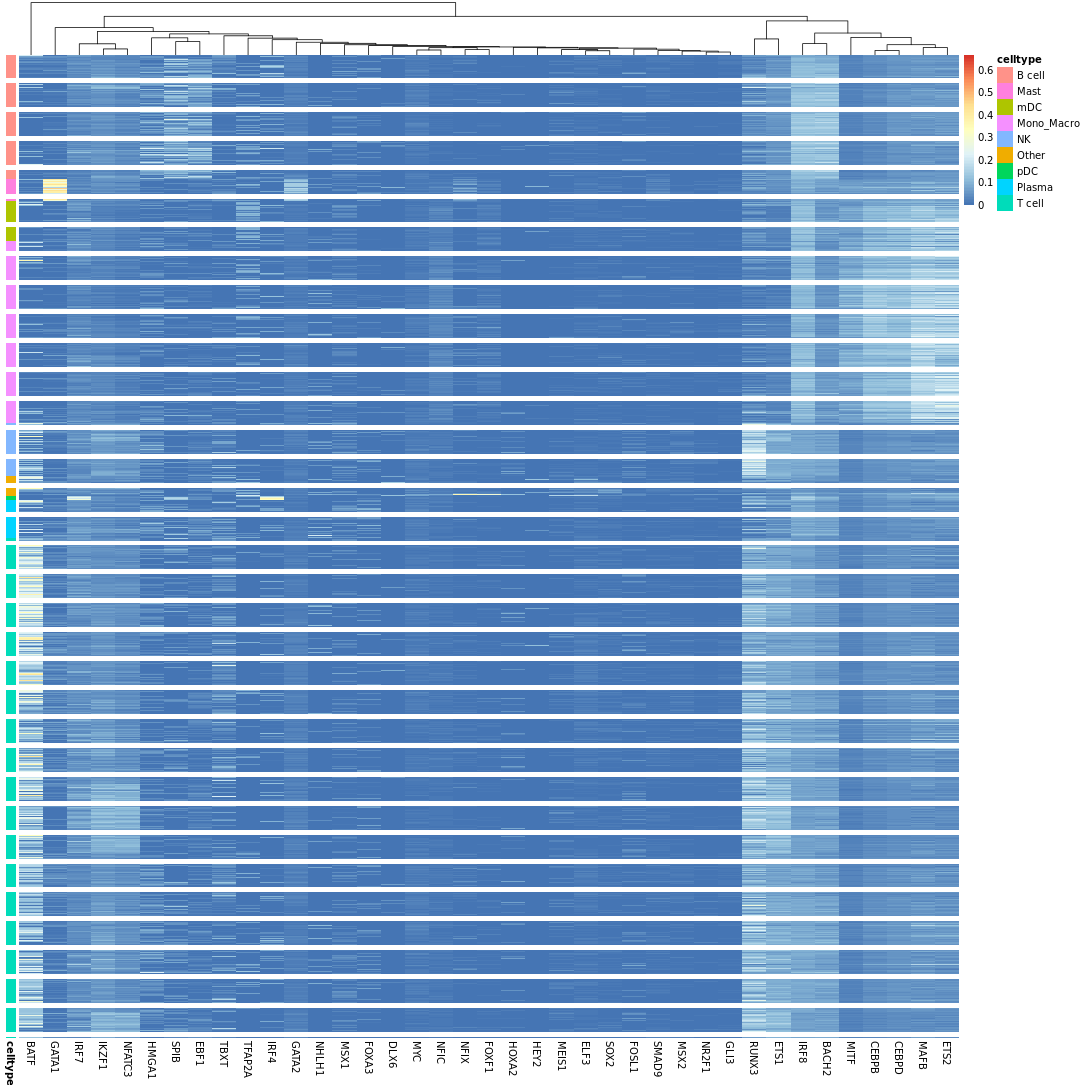
- Chart Interpretation: Displays a heatmap of regulon activity (AUC) in each cell.
- Color Meaning: Red indicates high activity, blue indicates low activity.
Binary Heatmap
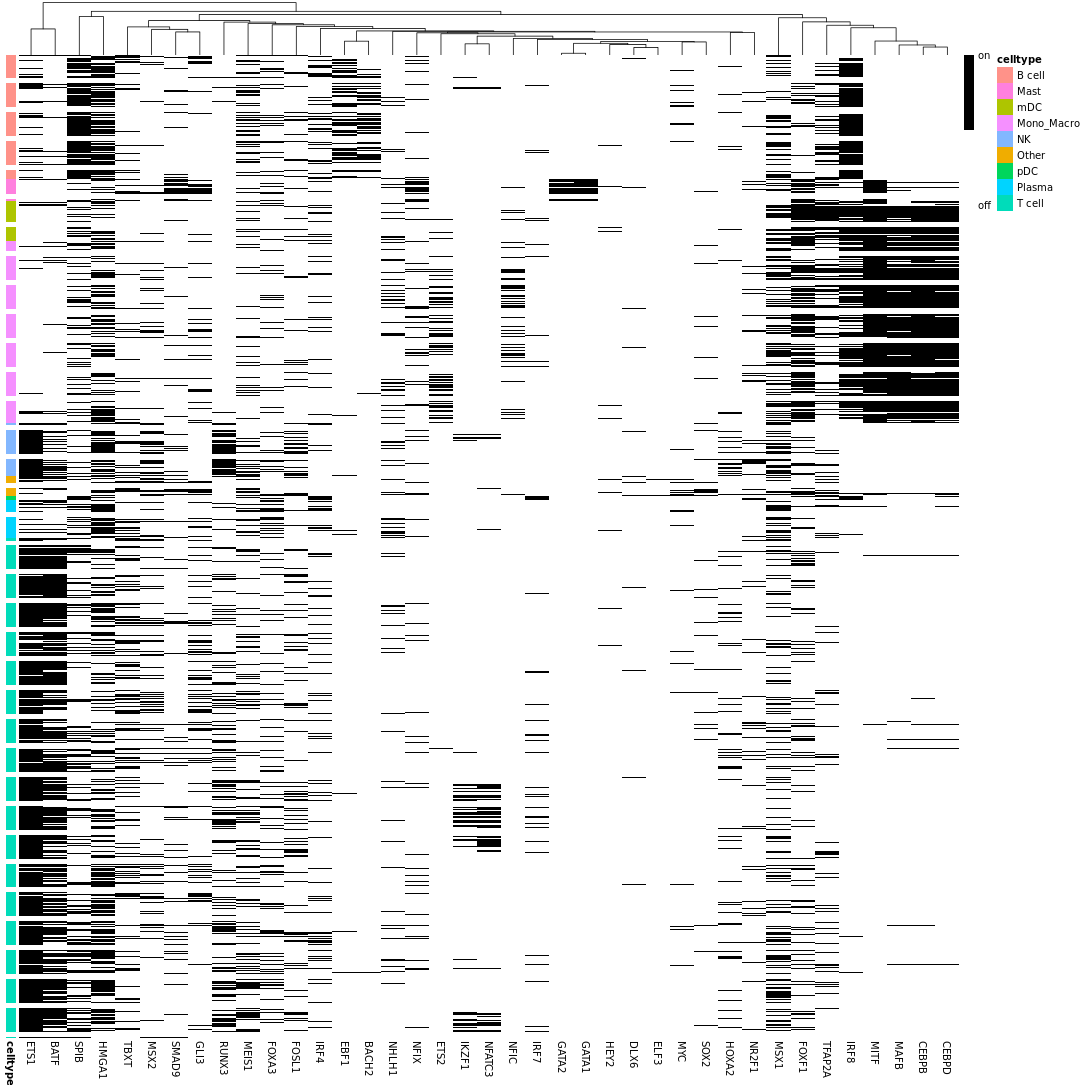
- Chart Interpretation: Binary heatmap converted based on AUC thresholds.
- Color Meaning: Black indicates regulon is in active state, white indicates regulon is in inactive state.
Dimensionality Reduction Plot
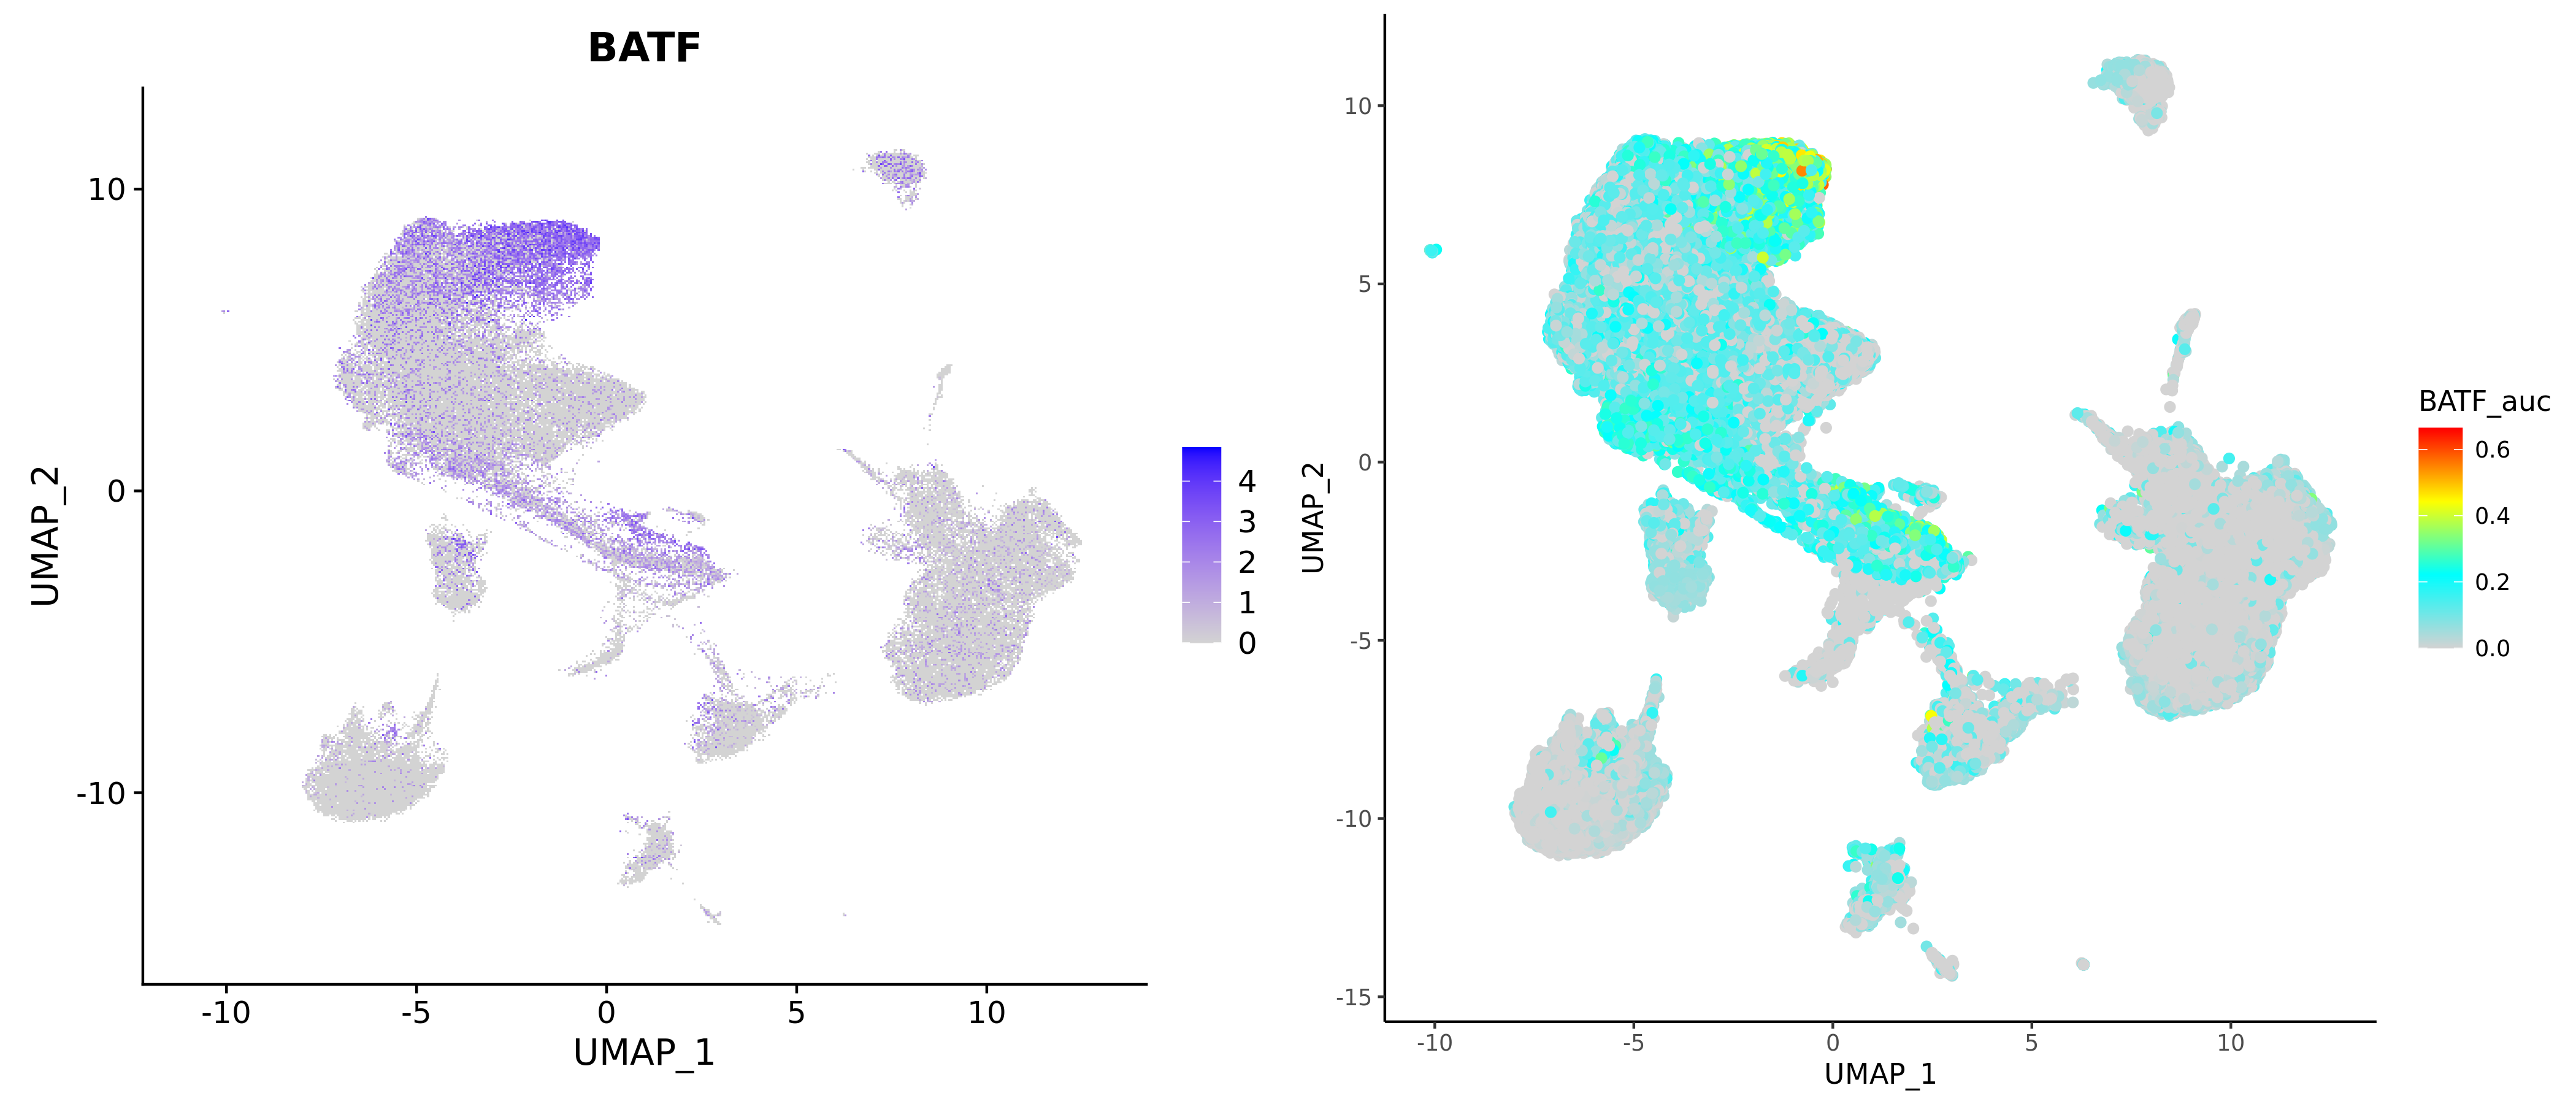
- Chart Interpretation: Displays spatial distribution of regulon activity on UMAP/tSNE plots.
- Left-Right Plot Comparison:
- Left plot: Expression level of regulon target genes
- Right plot: Spatial distribution of regulon activity (AUC)
Application Cases
Case 1: Identification of Key Transcription Factors in Tumor Microenvironment
- Literature: Aibar S, González-Blas CB, Moerman T, et al. Nat Methods. 2017.
- Background: The goal is to identify transcription factors (Regulons) with specific regulatory activity in tumor-infiltrating immune cells to find potential therapeutic targets or biomarkers.
- Analysis Strategy: Run complete SCENIC workflow (GENIE3/GRNBoost → RcisTarget → AUCell) in annotated immune cell groups (such as CD8+ T cells, macrophages), calculate AUC of each Regulon in cells and filter cell type-specific Regulons based on RSS scores; combine results with differential expression genes and clinical phenotypes (such as immune checkpoint expression) for joint analysis.
- Core Findings:
- Identified several Regulons with high RSS in tumor-associated macrophages (e.g., STAT3-related Regulon), with AUC significantly upregulated in tumor samples.
- Target genes of these Regulons are enriched in "inflammatory response" and "immune suppression" pathways, consistent with immune suppression phenotypes in clinical samples.
- Some transcription factors with high RSS have also been reported in literature review to be related to tumor immune microenvironment regulation, supporting result reliability.
Case 2: Dynamic Reconstruction of Regulatory Networks During Development or Differentiation
- Literature: Van de Sande B, Flerin C, Davie K, et al. Nat Protoc. 2020.
- Background: Study how transcriptional regulatory networks are reconstructed over time during cell fate decisions, identifying negative/positive regulatory dominant factors.
- Analysis Strategy: Run SCENIC separately on single-cell data from different developmental stages or differentiation time points, compare Regulon AUC matrices and RSS distributions at different time points, focus on Regulons that change significantly over time and combine motif information to validate direct regulatory possibilities.
- Core Findings:
- Identified several Regulons with high activity in early differentiation (such as certain stem cell maintenance-related TFs), with AUC decreasing as differentiation progresses; simultaneously, a group of Regulons related to terminal differentiation states show increased AUC.
- Motif enrichment analysis supports that some Regulons are direct regulatory relationships, suggesting these TFs may play causal roles in fate decisions.
Case 3: Identification and Validation of Regulon Responses Under Drug/Treatment Conditions
- Literature: Huynh-Thu VA, Irrthum A, Wehenkel L, et al. PLoS One. 2010.
- Background: Evaluate the impact of drug treatment on cell regulatory networks, screening key Regulons induced or inhibited by drugs.
- Analysis Strategy: Merge treatment group and control group data, run SCENIC and calculate AUC for each cell; perform differential analysis on inter-group AUC, screen significantly changed Regulons and validate possible direct targeting relationships through enrichment analysis and external data (such as ChIP-seq).
- Core Findings and Validation:
- Found that some Regulons have significantly decreased AUC in the treatment group, suggesting drugs may function by inhibiting specific TF activity.
- After combining ChIP-seq or public database validation, confirmed that some target genes are direct targets of this TF, providing molecular evidence for drug action mechanisms.
Notes and Best Practices
TIP
Avoid Overinterpretation: SCENIC results are computational inferences based on transcriptome data and do not equal real regulatory relationships. Any key findings require subsequent biological experiments (such as ChIP-seq, reporter gene experiments) to confirm.
Frequently Asked Questions (FAQ)
Q1: How long does SCENIC analysis take?
A: Analysis time depends on data scale and computational resource configuration. Generally:
- Small datasets (1,000-5,000 cells): 1-2 hours
- Medium datasets (5,000-20,000 cells): 2-6 hours
- Large datasets (>20,000 cells): 6-24 hours or longer It is recommended to enable Downsample to speed up analysis.
Q2: What is the significance of NES values and AUC values?
A:
- NES (Normalized Enrichment Score): Normalized enrichment score, used to evaluate the significance of motif enrichment. NES>3 is usually considered significant enrichment.
- AUC (Area Under the Curve): Area under the curve, used to calculate NES, and also reflects regulon activity level.
Q3: What is the difference between RSS and Z-score?
A:
- RSS (Regulon Specificity Score): Regulon specificity score, measuring the specificity of regulons in specific cell types. Higher values indicate greater specificity of the regulon in that cell type.
- Z-score: Standardized activity score, measuring the relative activity of regulons in specific cell types. Higher values indicate stronger activity of the regulon in that cell type.
Q4: How to verify the reliability of SCENIC analysis results?
A: Result reliability can be verified through the following methods:
- Biological Validation: Validate key regulatory relationships by combining known literature and databases
- Experimental Validation: Validate key regulatory factors through ChIP-seq, reporter gene experiments, and other methods
- Cross-Validation: Verify result consistency using different datasets or analysis methods
References
Aibar S, González-Blas CB, Moerman T, et al. SCENIC: single-cell regulatory network inference and clustering. Nat Methods. 2017 Nov;14(11):1083-1086. doi: 10.1038/nmeth.4463. Epub 2017 Oct 9. PMID: 28991892; PMCID: PMC5937676
Huynh-Thu VA, Irrthum A, Wehenkel L, et al. Inferring regulatory networks from expression data using tree-based methods. PLoS One. 2010 Sep 28;5(9):e12776. doi: 10.1371/journal.pone.0012776. PMID: 20927193; PMCID: PMC2946910
Van de Sande B, Flerin C, Davie K, et al. A scalable SCENIC workflow for single-cell gene regulatory network analysis. Nat Protoc. 2020 Jul;15(7):2247-2276. doi: 10.1038/s41596-020-0336-2. Epub 2020 Jun 19. PMID: 32561888
He Y, Chen Q, Dai J, et al. Single-cell RNA-Seq reveals a highly coordinated transcriptional program in mouse germ cells during primordial follicle formation. Aging Cell. 2021 Jul;20(7):e13424. doi: 10.1111/acel.13424. Epub 2021 Jun 26. PMID: 34174788;PMCID: PMC8282241
Wang JJ, Ge W, Zhai QY, et al. Single-cell transcriptome landscape of ovarian cells during primordial follicle assembly in mice. PLoS Biol. 2020 Dec 22;18(12):e3001025. doi: 10.1371/journal.pbio.3001025. PMID: 33351795; PMCID: PMC7787681
Zhao B, Jiang X. hsa-miR-518-5p/hsa-miR-3135b Regulates the REL/SOD2 Pathway in Ischemic Cerebral Infarction. Front Neurol. 2022 Apr 11;13:852013. doi: 10.3389/fneur.2022.852013. PMID: 35481271; PMCID: PMC9038098